RS10k Spectra
The spectra below showcase the performance of the RS10k echelle spectrometer for different applications. Each spectrum has been acquired in a single shot, containing data in the range from 450-1030 nm. Please note, certain spectra have been restricted in their range to display particular interesting features in more detail.
Plasma Spectroscopy
The RS10k spectrometer can see the light fingerprint that reveals what chemistry and surface science is happening in real-time. We were excited to prove this in some tests at ARC Centre of Excellence for Quantum Computation and Communication Technologies (UNSW Sydney) where they're reactive ion etching with either O2/SF6 plasmas or with CF4/CHF3/Ar plasmas tiny quantities of silicon for quantum computers.

Characterisation of Light Sources
The RS10k can reveal the longitudinal modes of diode lasers. The plot below shows the spectrum of an inexpensive fibre optic cable tester with 650±20 nm central peak wavelength.

The plot below shows a spectrum of Thorium-argon (Th-Ar) which is commonly used to calibrate high-resolution echelle spectrometers at astronomical observatories. Thorium emits narrow spectral lines in the ultraviolet, visible, and near-infrared that can be used as a precise reference. The spectrum also contains orders of magnitude brighter argon lines.

Teaching Tool in Physics Labs
Atomic orbitals can be labelled by a quantum number Mj indicating the total angular momentum. In a vapour lamp the excited atoms emit resonant light as they relax from a higher state to a lower state, and the optical transitions are only allowed if the spin number Mj differs by 1 or less. Transitions where Mj changes by -1 lead to sigma(-) circular polarised light, and transitions where Mj changes by +1 lead to sigma(+) circular polarised light. The Zeeman splitting of spin levels in an external magnetic field can be measured spectrally, and is made easier by using polarisation to independently isolate the sigma(-) and sigma(+) transitions. The Zeeman splittings of 4 different atomic transitions of Cadmium were recorded simultaneously, and are shown to have different spin-orbit couplings.

Astrophotonics
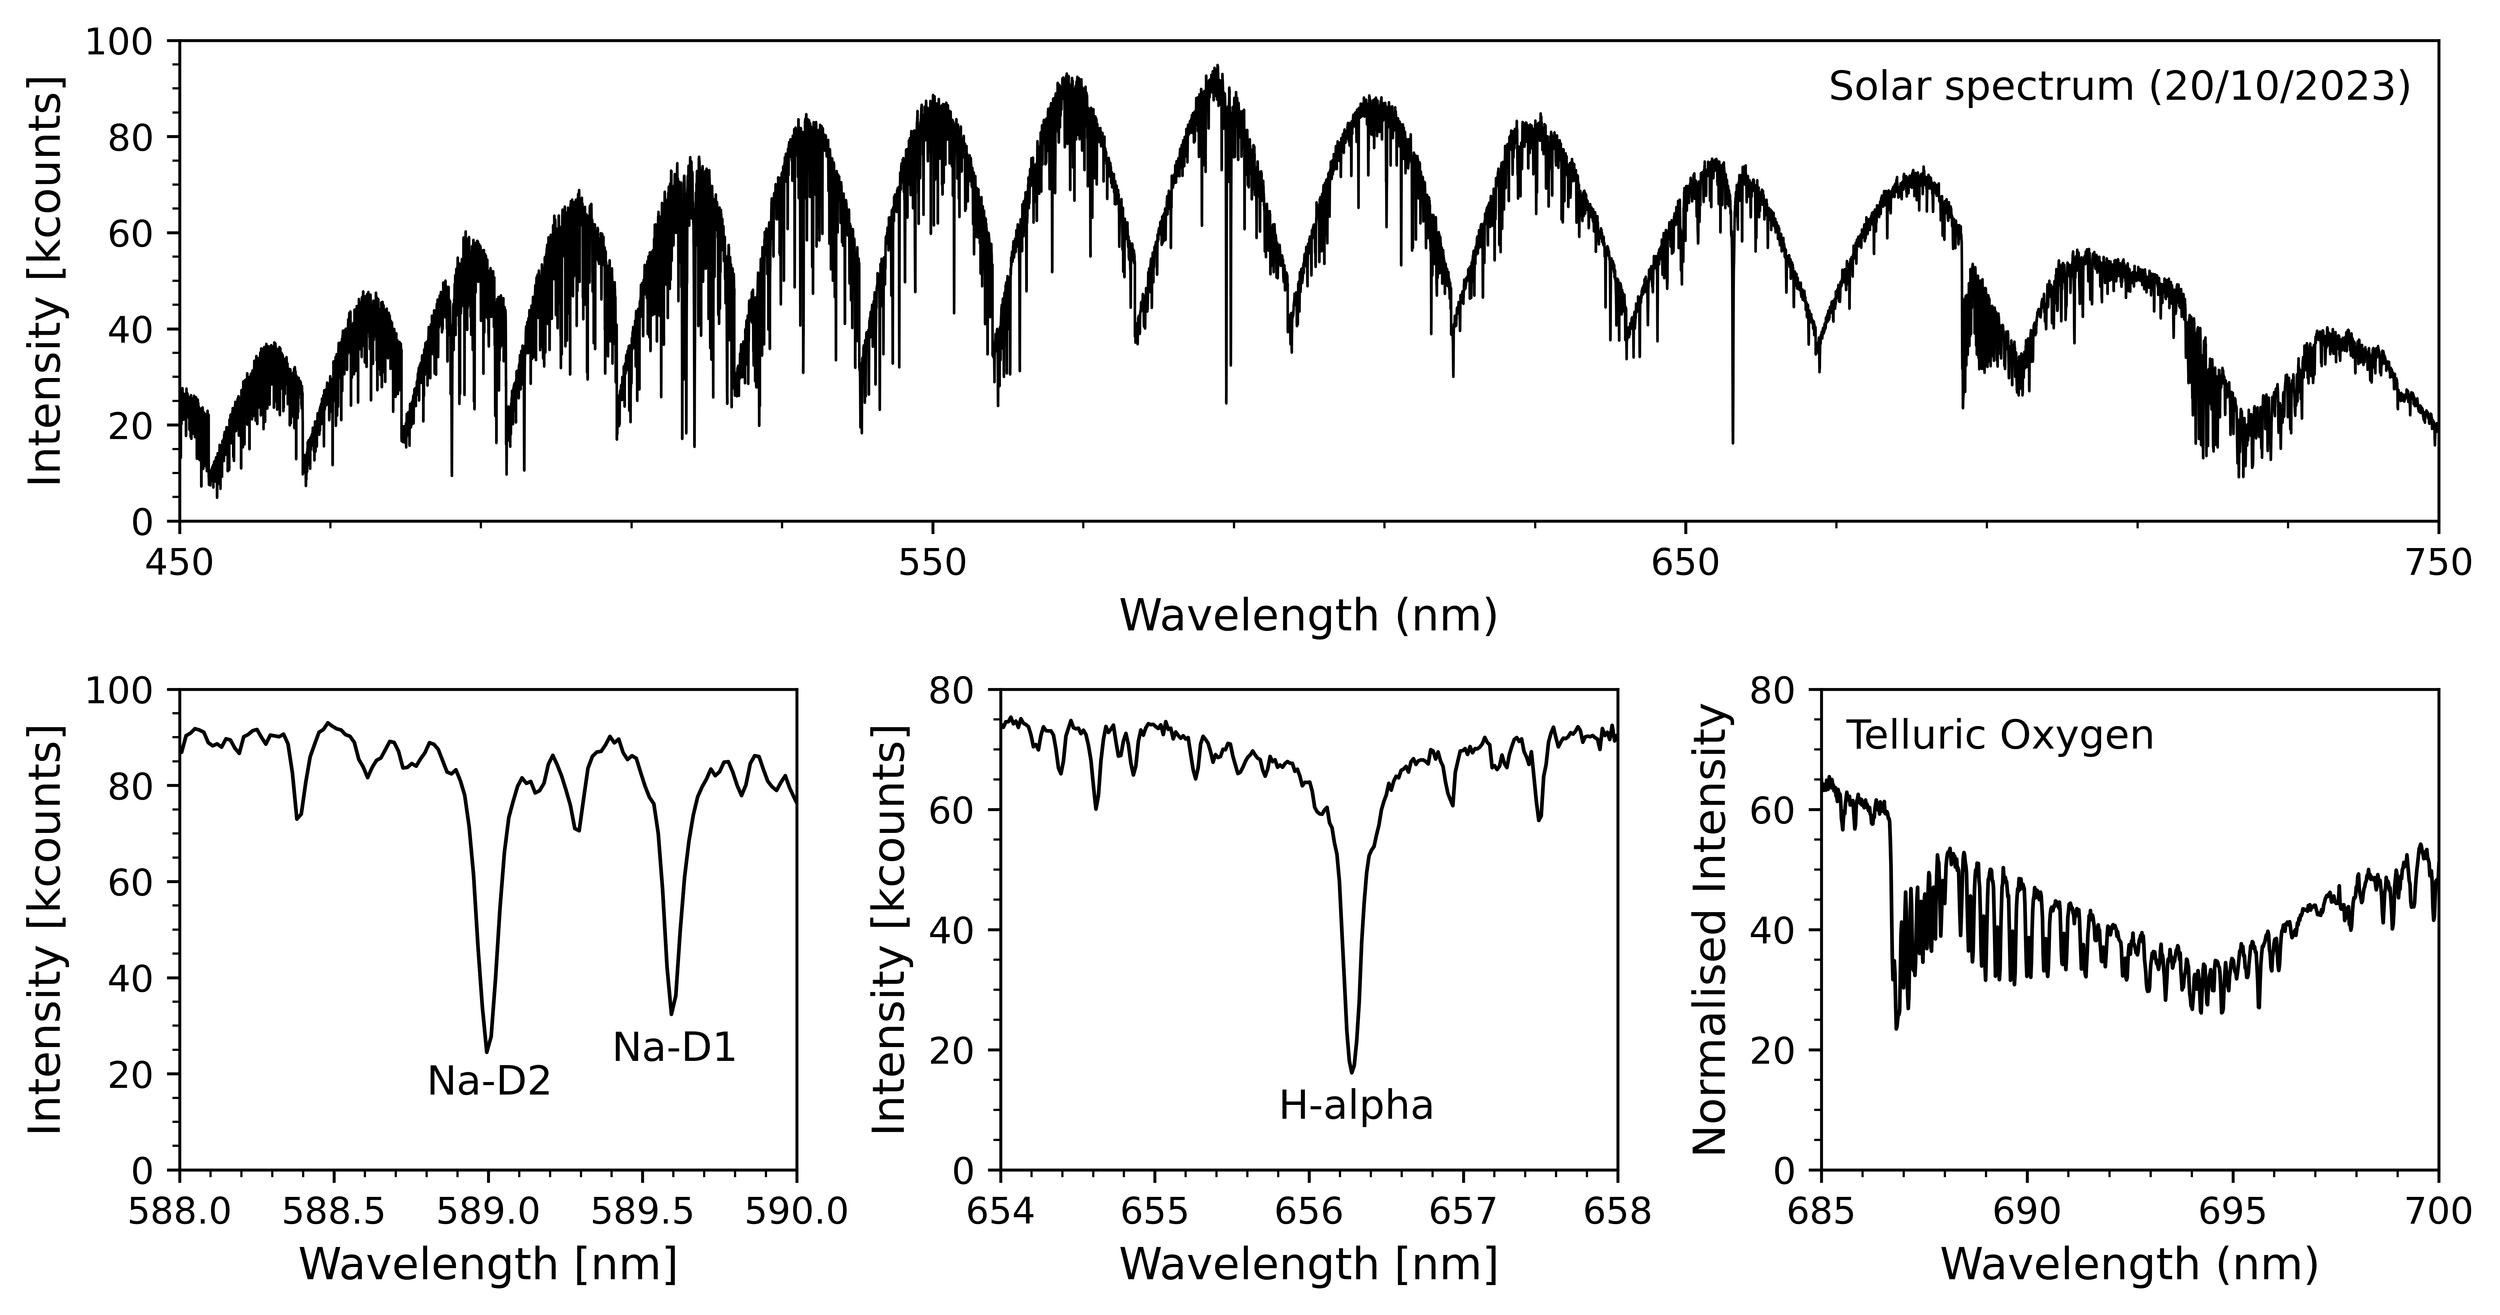
The plot below shows a 300 nm wide fraction of the solar spectrum and detailed plots of prominent features (e.g. sodium doublet). The solar spectrum was captured while pointing the single-mode fibre at the Sun.