RS40k Example Spectra
The spectra below showcase the performance of the RS40k echelle spectrometer. Each spectrum has been acquired in a single shot, containing data from 430-950 nm. Certain spectra have been restricted in their range to display particular interesting features in more detail.
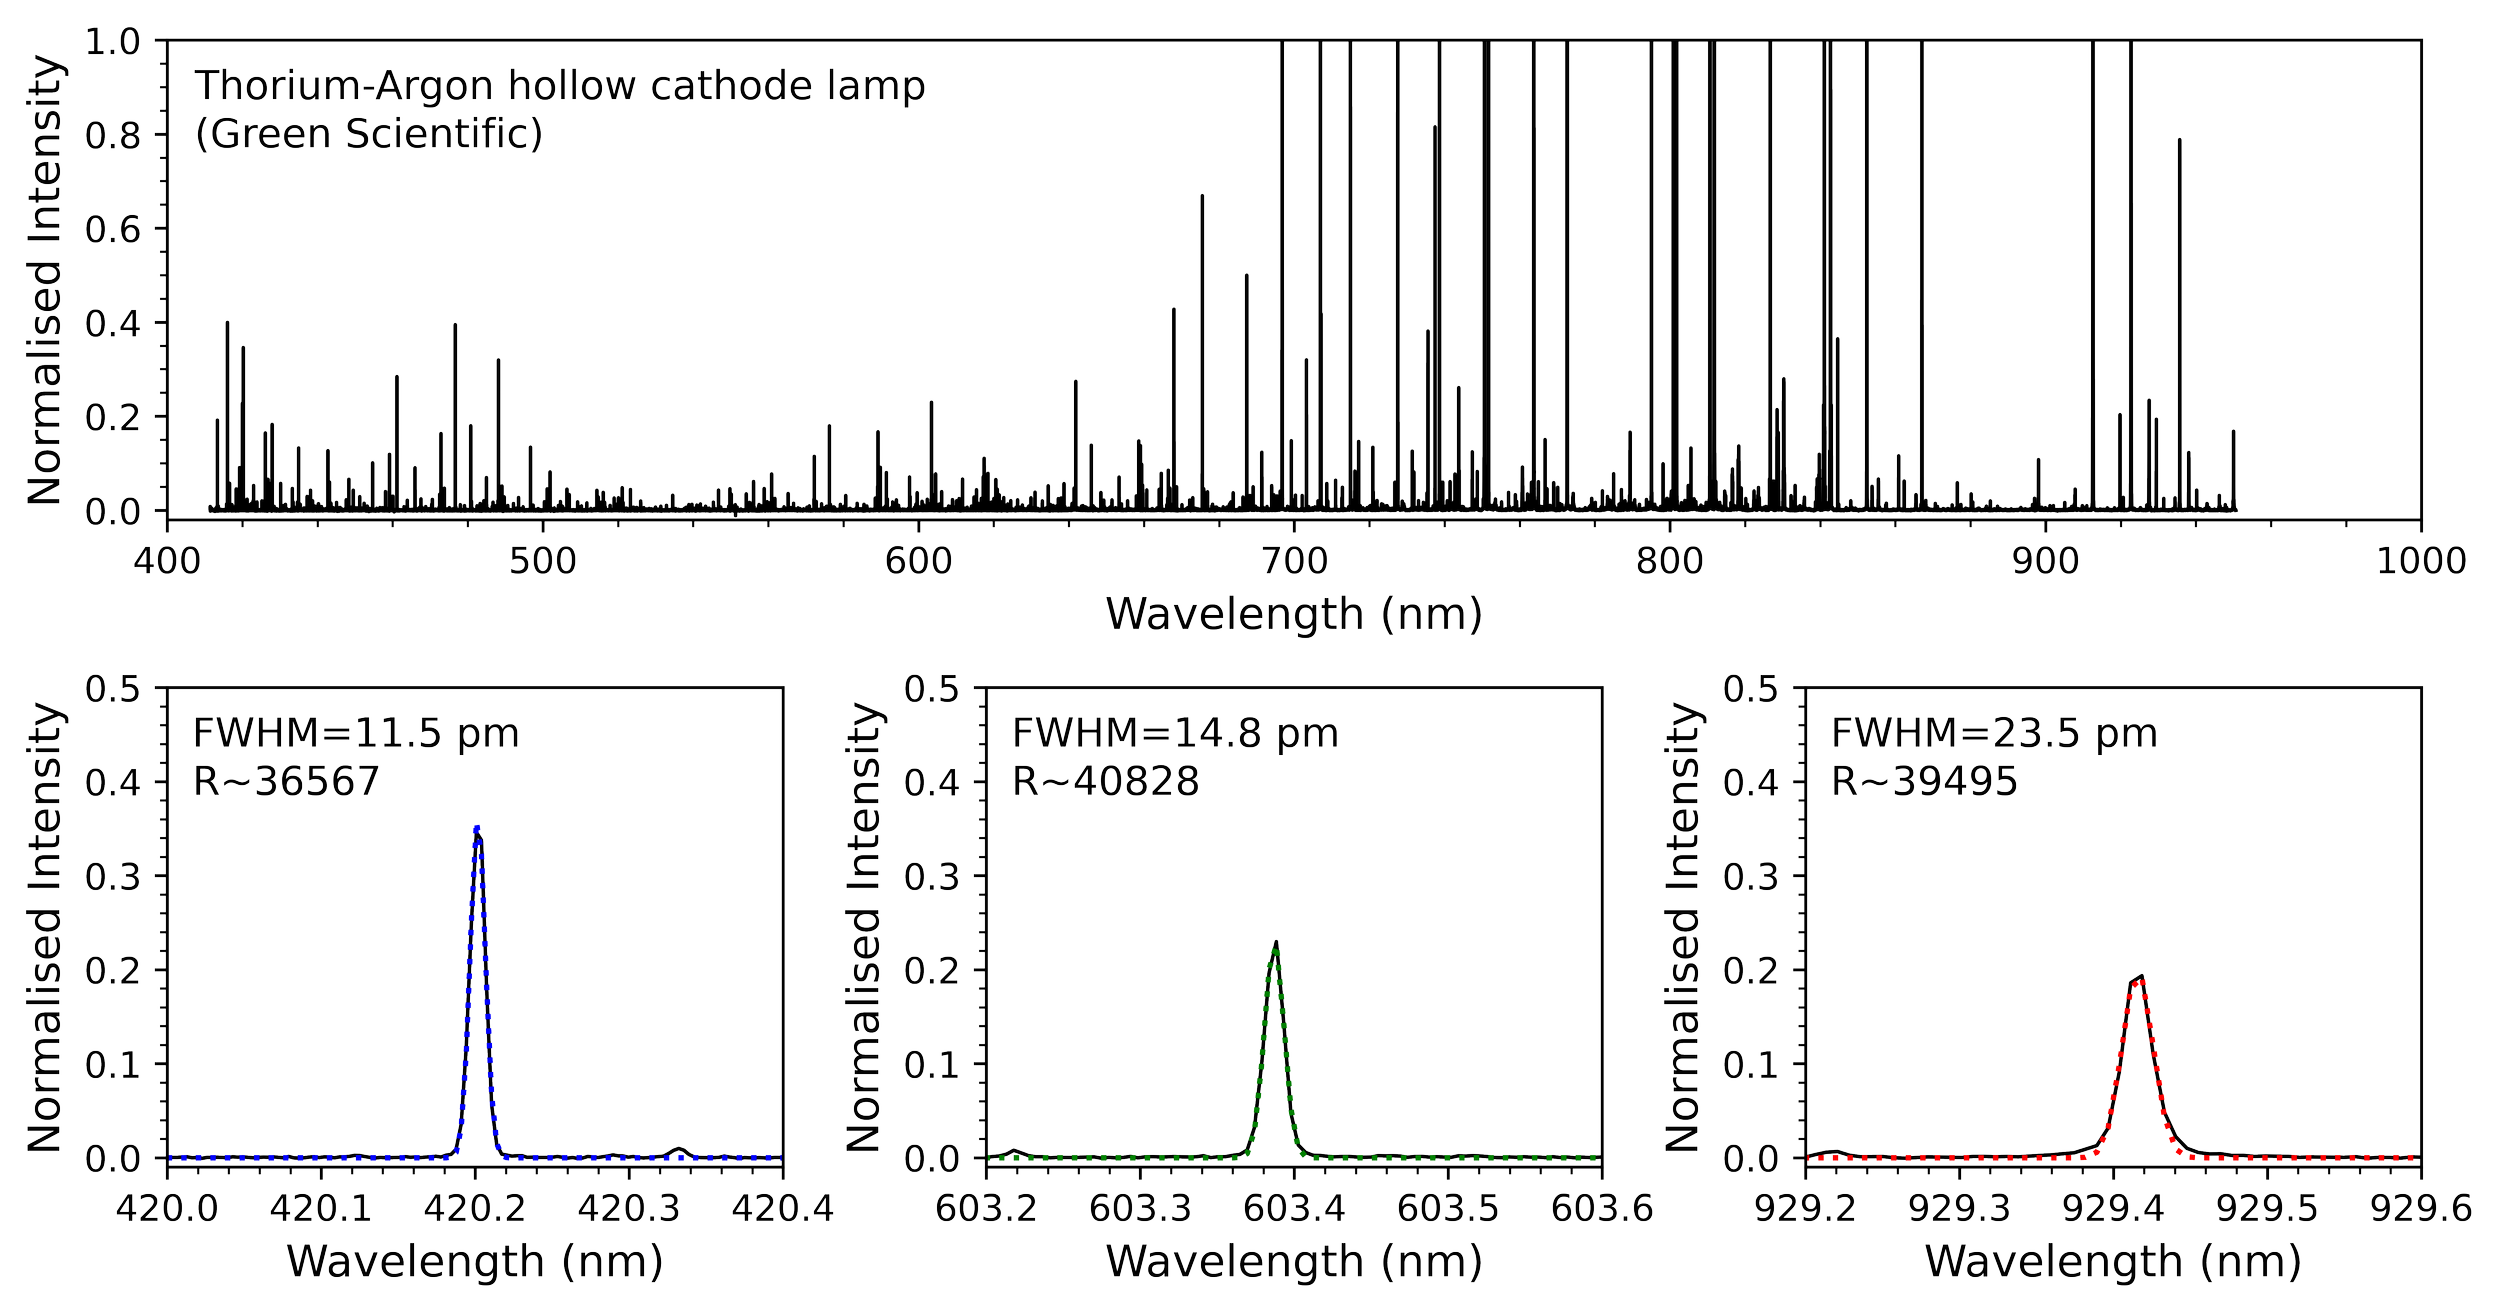
Characterisation of Light Sources
The plot below shows a spectrum of thorium-argon (Th-Ar). These elements emit bright, well-defined narrow spectral lines in the ultraviolet, visible, and near-infrared. Light emission is created by heating a small amount of thorium and argon to high temperatures, causing them to emit light. The resulting spectrum contains 100s of bright emission lines that can be used as a precise reference for identifying and measuring the wavelengths of other light sources in a spectrum.
The plot below shows a spectrum of an inexpensive fibre fault detector with 650±20 nm central peak wavelength. Diode lasers typically emit a beam that has a small range of wavelengths, known as an optical bandwidth. This is caused by the fact that multiple different modes of oscillation are happening simultaneously within the resonator of the laser diode. These can include both longitudinal and transverse modes, leading to a multimode laser diode.

The plot below shows a spectrum of sodium-argon (Na-Ar). The most prominent feature in the Na-Ar spectrum is the bright yellow line pair known as the sodium doublet. The doublet is caused by the transitions of electrons between two energy levels in the sodium atom. The two lines at 588.9950 nm (Na-D2) and 589.5924 nm (Na-D1) are easily recognizable and well separated at R~40,000 resolving power.

The plot below shows a spectrum of neon (Ne). When a high voltage is applied to a tube containing neon gas, the gas becomes excited and emits light, producing a distinct spectrum of colors. The neon spectrum consists of bright, glowing lines of red, orange, yellow, green, blue, indigo, and violet. These colors correspond to specific wavelengths of light that are emitted by the neon gas. The most prominent color in the neon spectrum is a deep red-orange color.

Astrophotonics
The plot below shows a small fraction (one echelle order) of the solar spectrum around the H-alpha line at 656.28 nm. The solar spectrum was acquired while pointing the single-mode fibre at the Sun. The solar spectrum includes thousands of absorption lines, caused by the presence of different elements in the Sun's atmosphere, which can be used to study the Sun's composition and temperature.
